
I poked around mavproxy a bit and thought I’d share a few interesting commands to try.
(https://ardupilot.org/mavproxy/index.html](https://ardupilot.org/mavproxy/index.html)
To circle at a point in flight, use:
mode GUIDED
RC 3 1500
mode CIRCLE
param set circle_radius 200
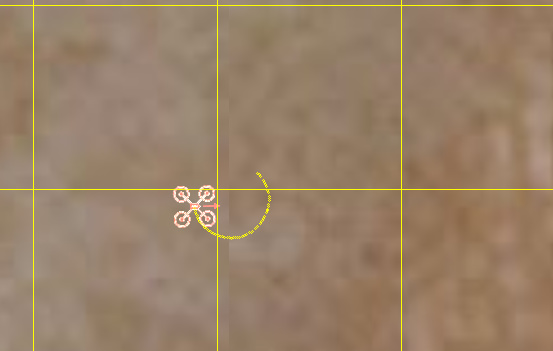
Note if you set the pwm value to 1550, the arrow appears to continue to point to the center, as if it were a camera on gimbal.
RC 3 1550
Another cool feature is mavproxy allows you to graph Live Data (https://ardupilot.org/mavproxy/docs/modules/graph.html?highlight=graphing).
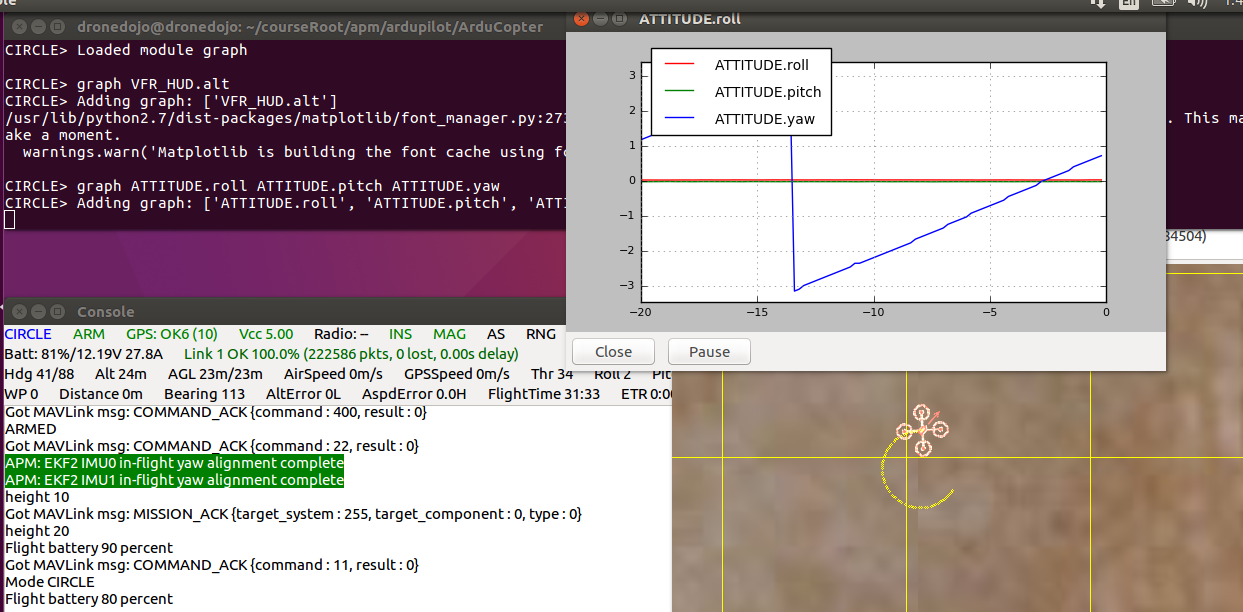
In the above example, the graph shows yaw changing as it circles, while pitch and roll state constant.
When mode is set to RTL, it provides some interesting insight to the changes of attitude as it lands.
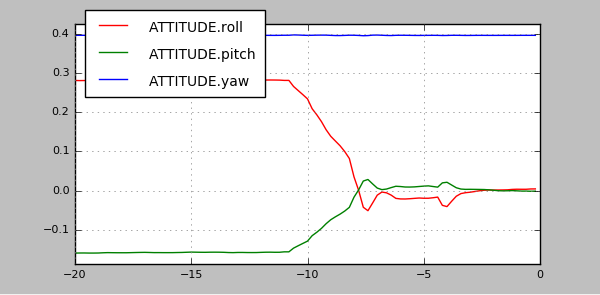
The graphing features can be useful to diagnose problems when testing various scenarios and scripts.
Note from ardupilot wiki in git:
Graphing vehicle state
MAVProxy allows you to create graphs of vehicle state. Numerous aliases have been created for useful graph types in the MAVProxy initialisation file (mavinit.scr). These all start with “g” and include gtrackerror, gaccel etc.
MAVProxy allows you to create graphs of inputs, outputs, internal variables, etc. by loading the graph module. You can then create graphs of vehicle state using the graph command. For example, to graph the RC channel 3 input during the simulation:
Since these are rather long to type, MAVProxy allows for the creation of shorter aliases. There have been many aliases created in a file present in the ArduPilot source tree in the Tools/vagrant sub-directory called mavinit.scr. If this file is copied and placed in your home directory and renamed to .mavinit.scr, it will be used upon MAVProxy’s initialization. Common ones are: g for graph, grc to graph the RC inputs, gservo8 to graph the first 8 output channels instead of typing long item names eight times, etc. Using this alias initialization file also has the advantage of automatically loading the graph module upon startup, so you will not have to load it.